How Sweden and Turkey Binge-Watch TV Series
From Stockholm to Istanbul, 200 viewers shared their take and Yasna just made it faster to hear them out.

Similar cases:
Are Market Researchers Allergic to AI?Consumer Insights About Sex ToysConversational Research EvolutionOur AI assistant Yasna talked to 200 men and women, aged 18-55, who have watched TV series and shows in the last 6 months across 2 countries, Sweden and Turkey. It took Yasna 2 days to conduct all interviews and process the data. Plus a couple of minutes to generate a comprehensive report with numerical validation.

Over 40% of TV series watchers stop watching shows due to strong and intense emotions! But there’s a surprising split between Sweden and Turkey.
Top highlights from the Yasna.ai report:
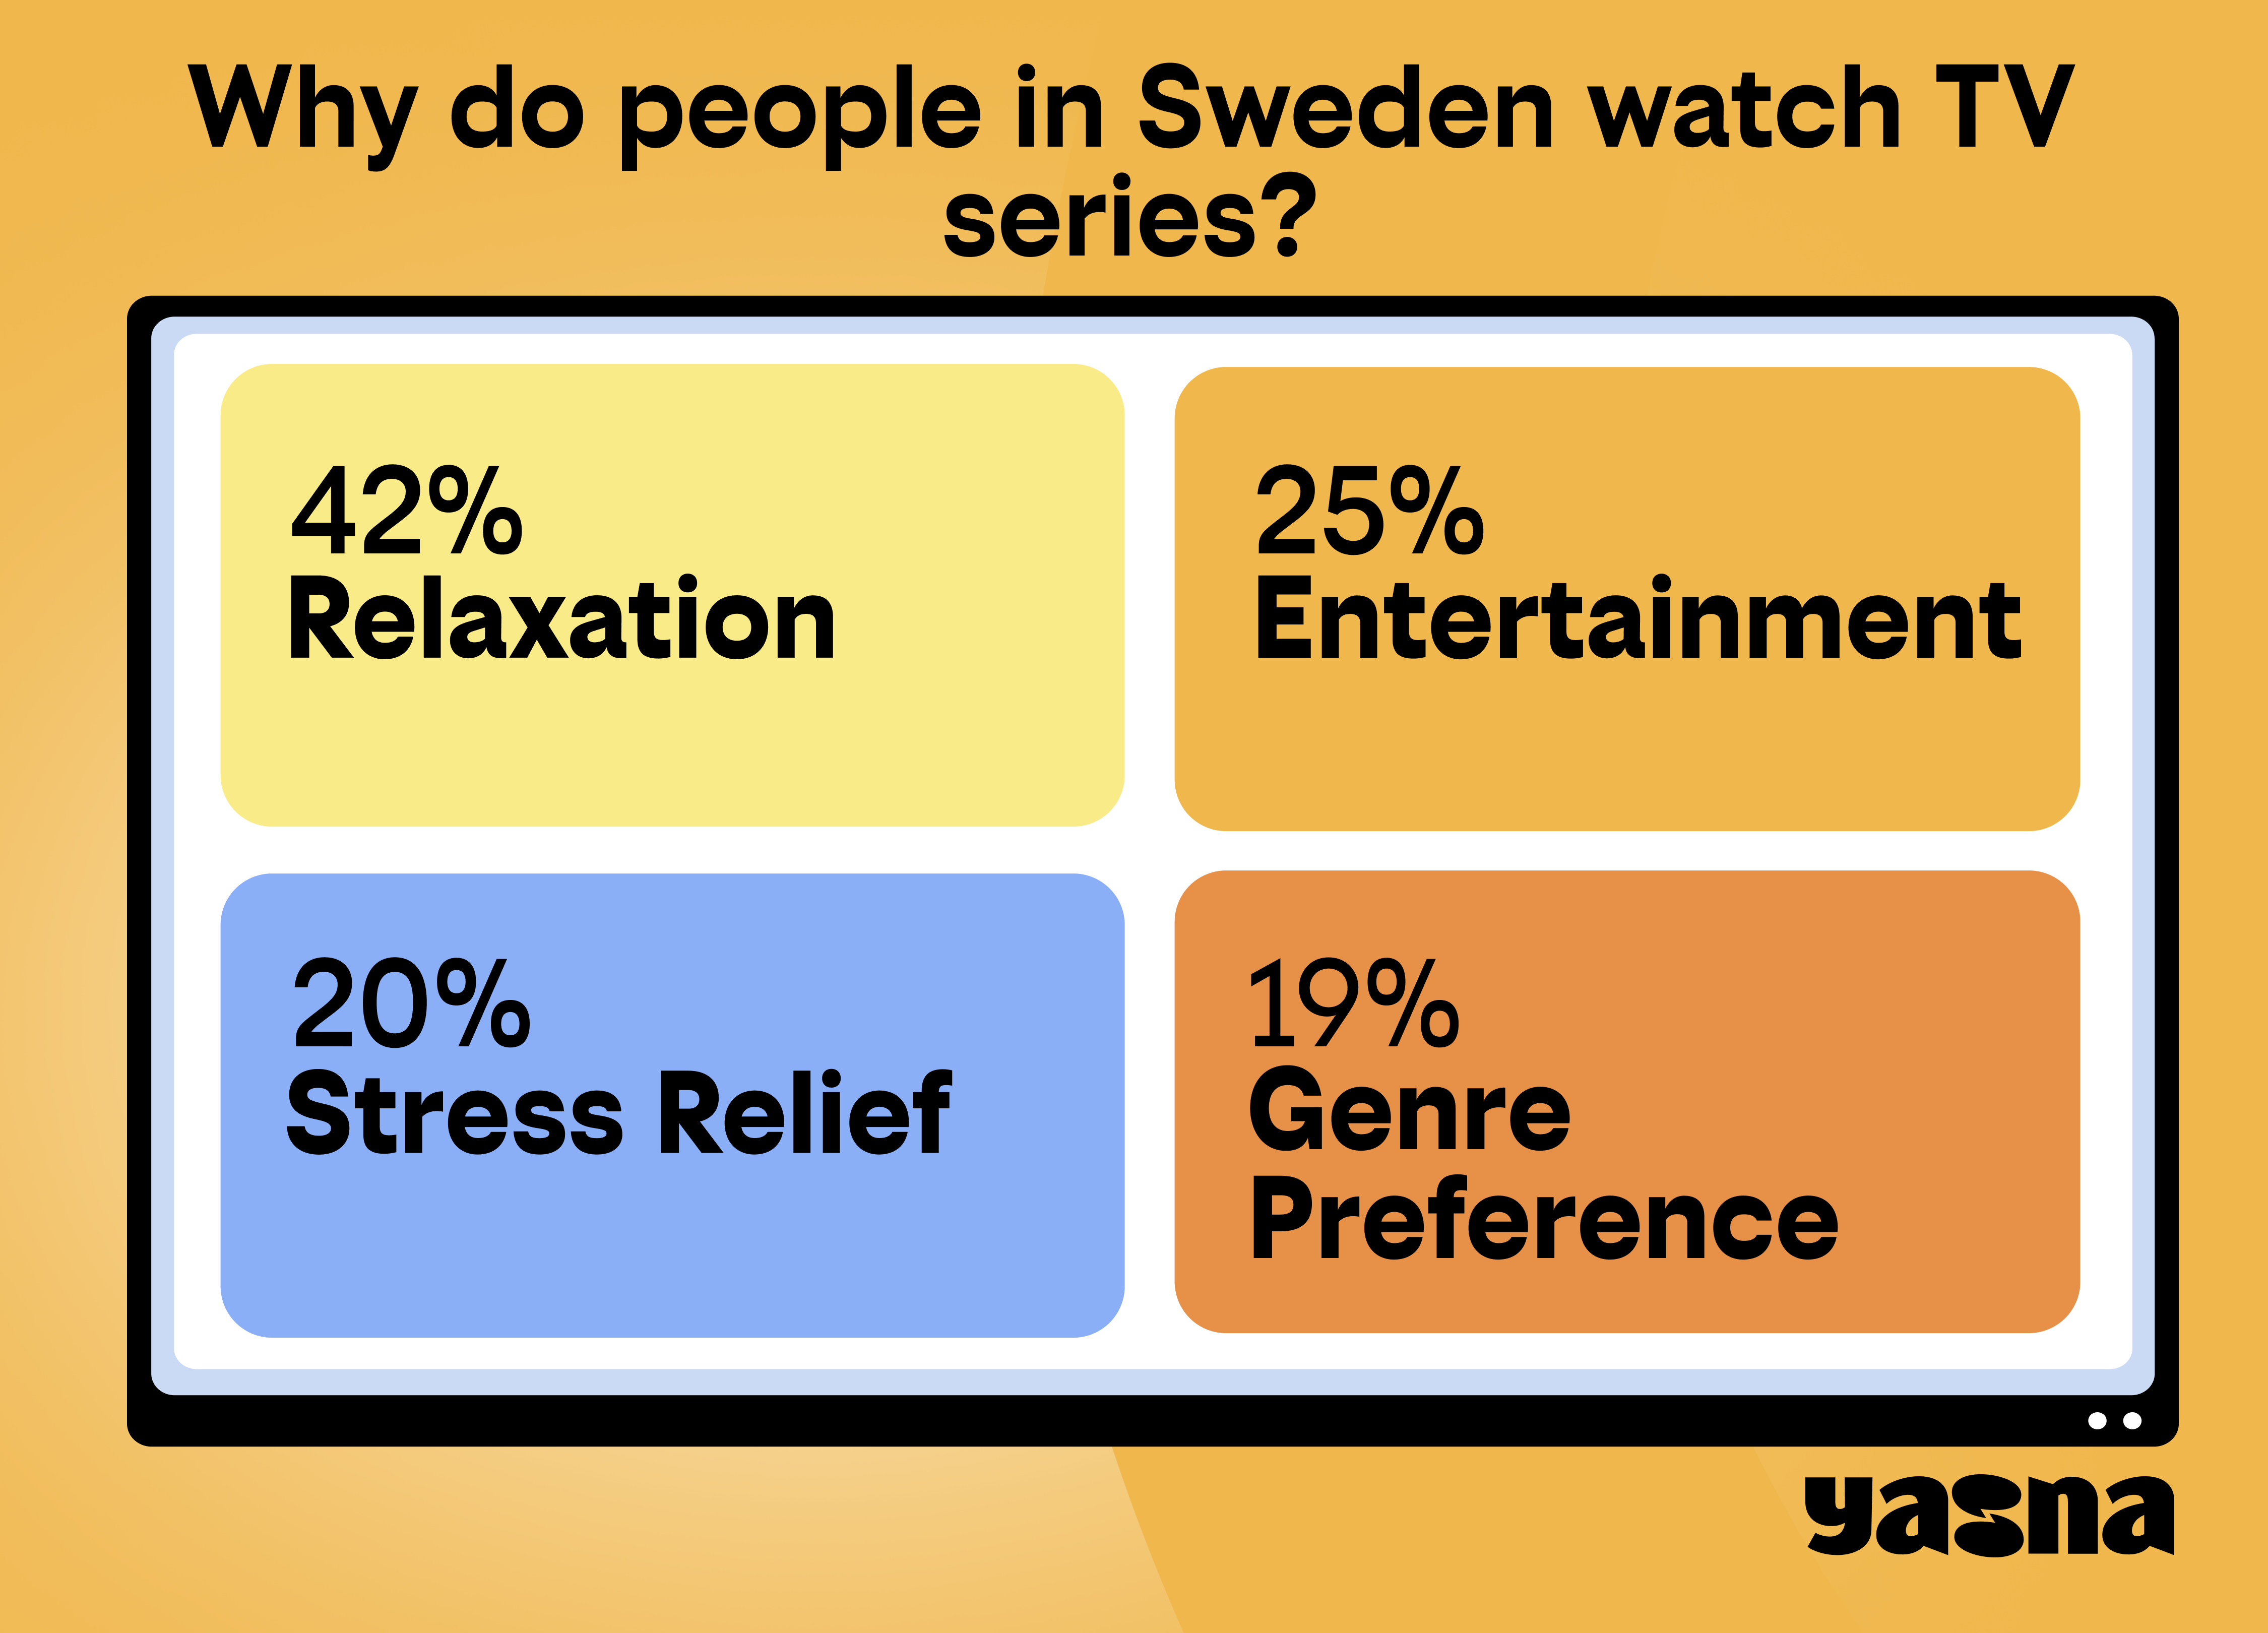
Swedish respondents prioritize relaxation.
42% of Swedish respondents binge to relax, 25% for entertainment purposes, and 20% for stress relief. TV series act as a cozy escape, helping viewers unwind from daily life, though they're quick to drop shows that stir too much fear or sadness (40% have quit due to emotions).
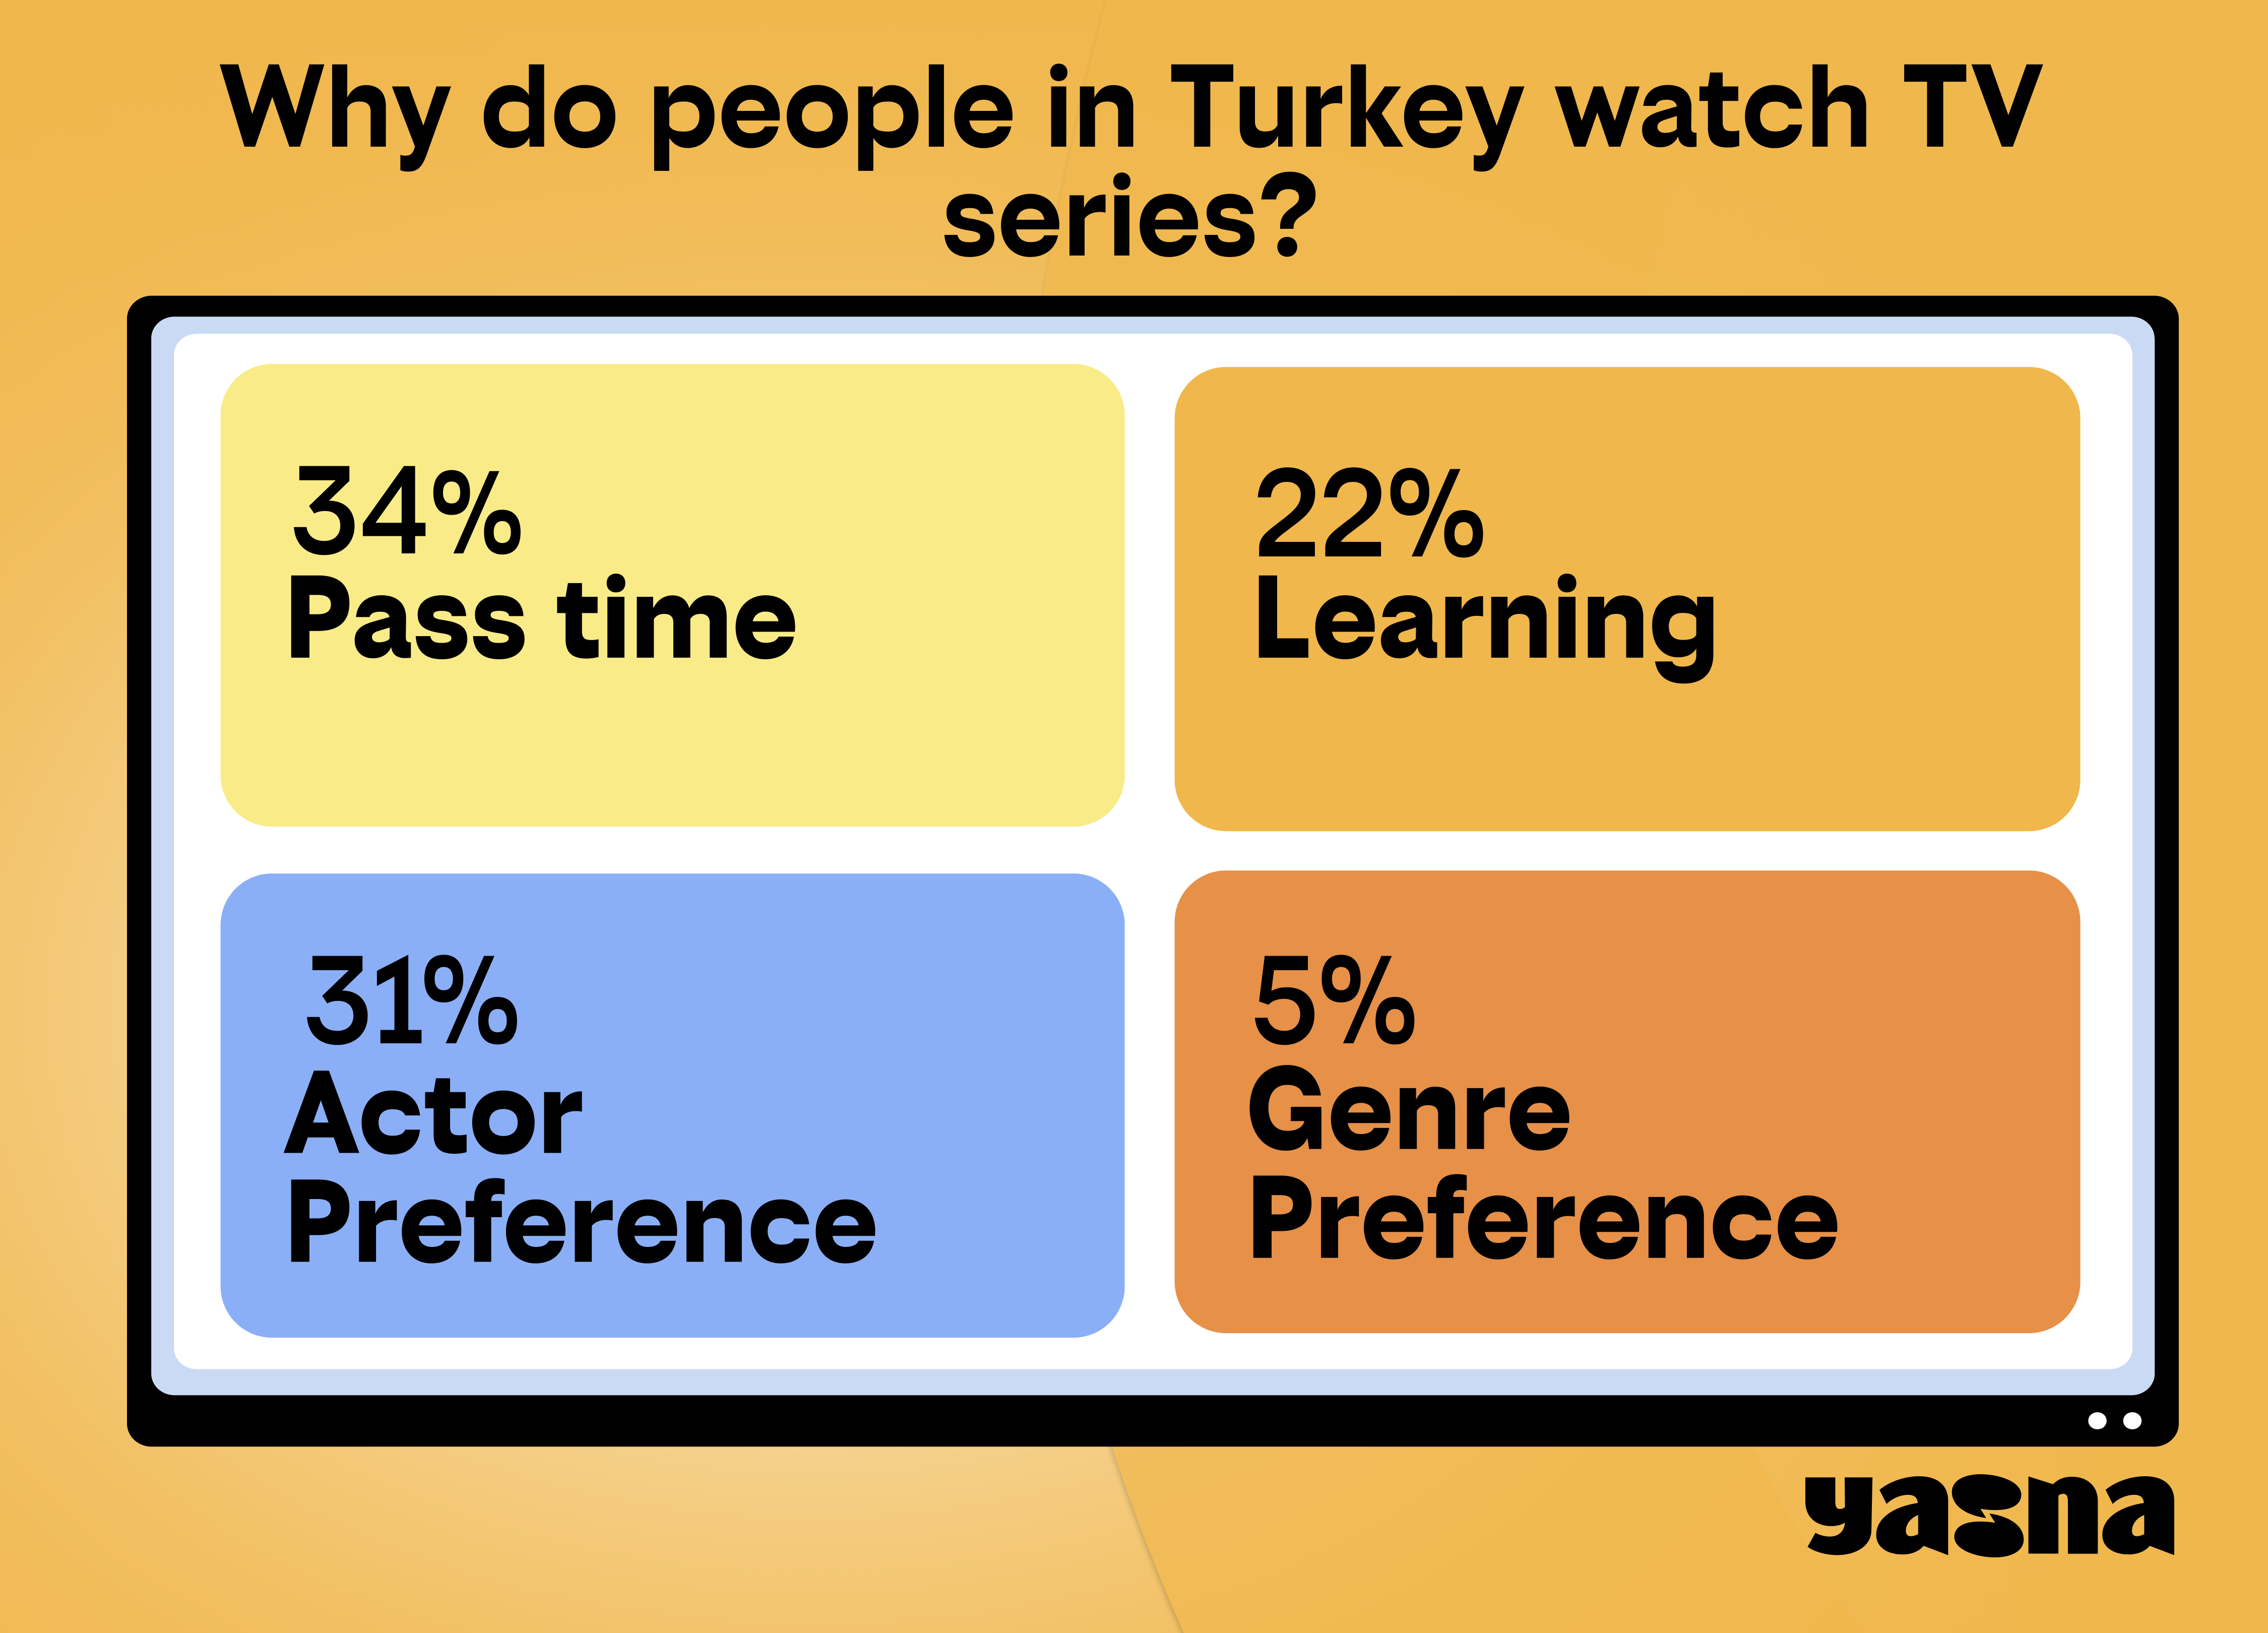
Turkish respondents watch mostly to pass time and learn something new.
34% of Turkish respondents watch to pass time, but 22% value learning new things like cultures, history, or moral lessons. Many said TV series spark curiosity and broaden perspectives, aka ‘to know more about what is happening in the world and how others live.’ Family bonding plays a bigger role here, with 22% watching with relatives or even friends.
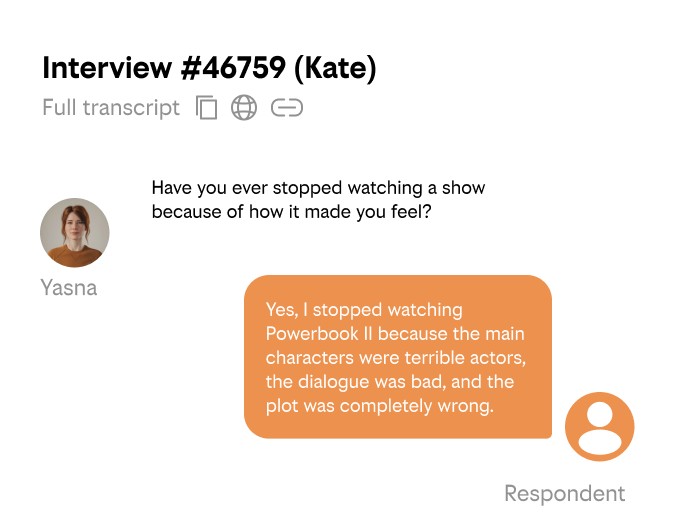
Plot matters for all, genre preferences differ.
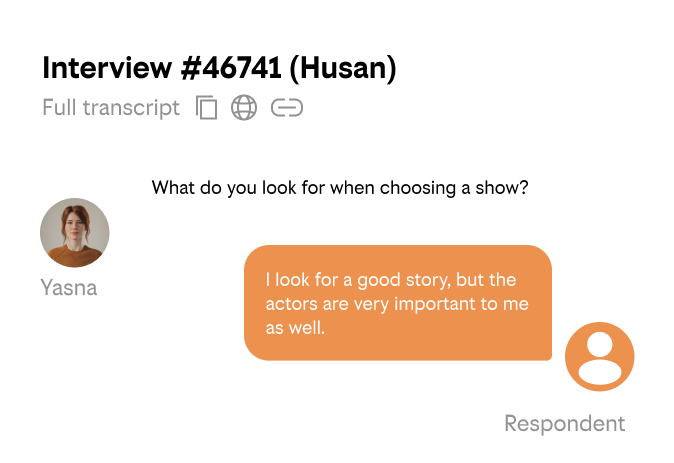
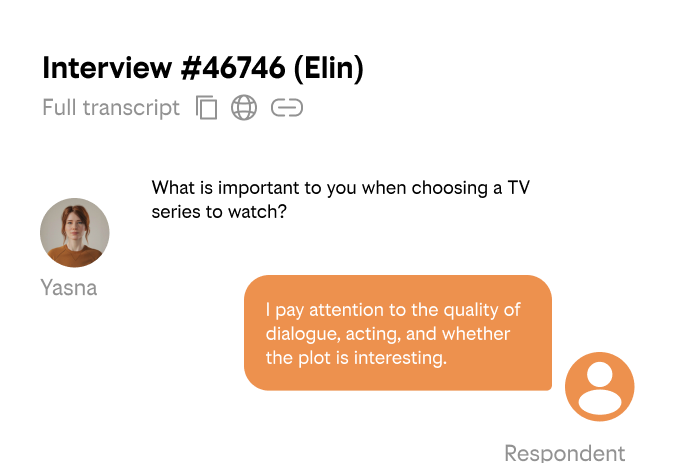
Across both countries, plot is very important (24%), but Turks prioritize actors (31%) while Swedes chase genres (19%). Drama, comedy, romance, and action unite them, yet Turks lean into sci-fi and historical epics, and Swedes favor horror, thrillers, and docs like 'Breaking Bad', 'Game of Thrones', 'Squid Game', and 'Friends'.
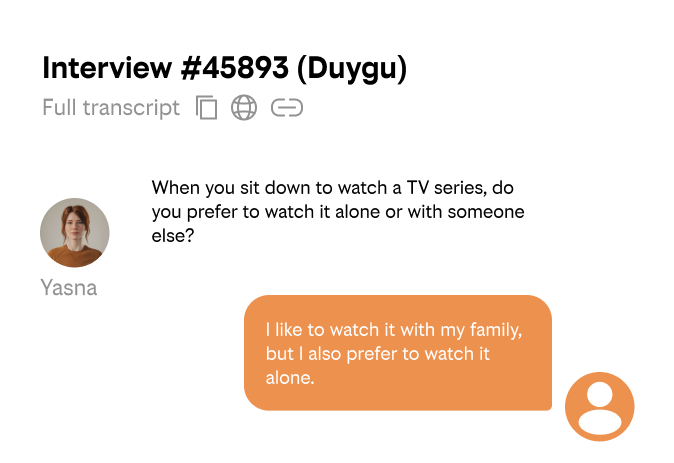
Alone time in Turkey, shared fun in Sweden.
Turks prefer watching alone (43%), but mix in family time (22%). Swedes blend solo binging (30%) and social viewing (41%), often with partners (30%) or friends (11%).

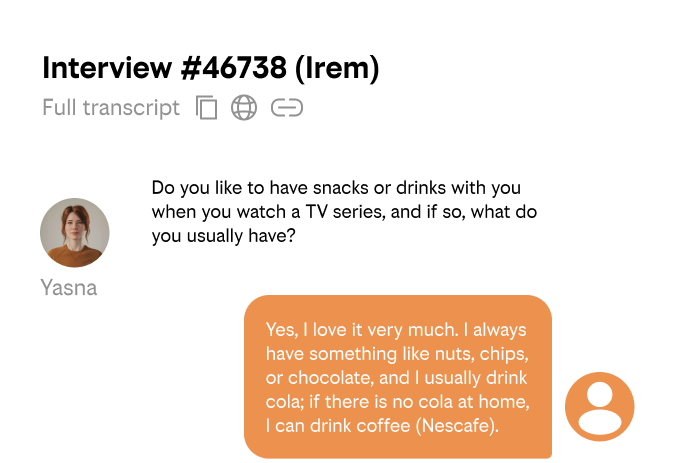
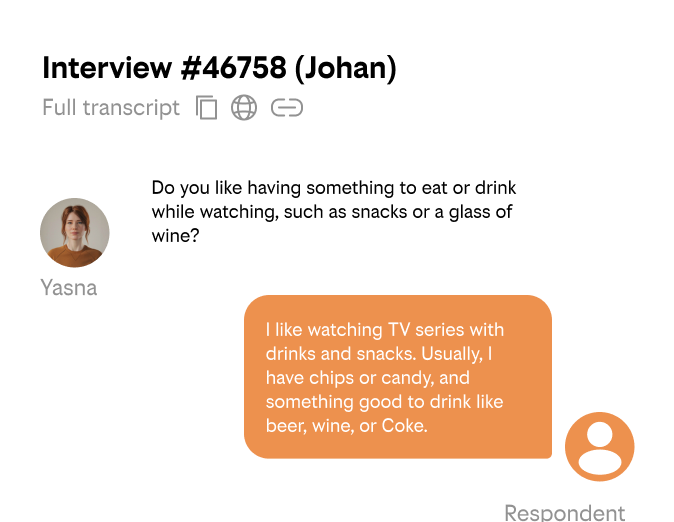
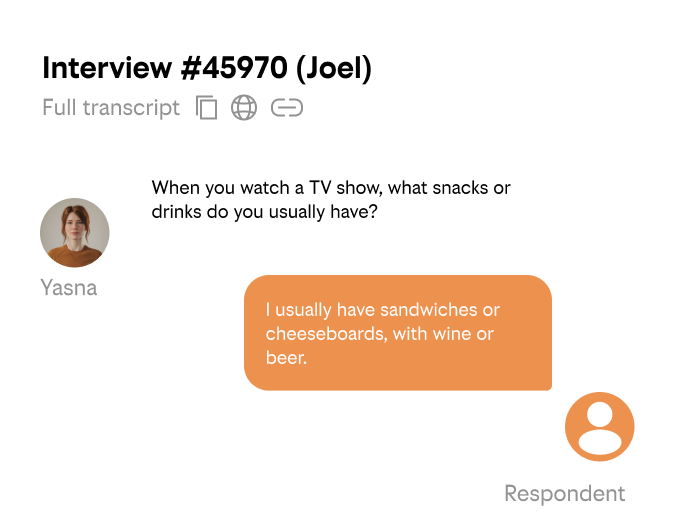
Snacks & drinks: relaxed rituals in Turkey, classic treats in Sweden.
Over 55% eat or drink something while watching. Swedes choose chips (40%) and sweets (24%), paired with coke (38%) or beer (14%). Turks prefer nuts (10%), tea (23%), or coffee (19%). Meanwhile, alcohol is rare (3% for beer).
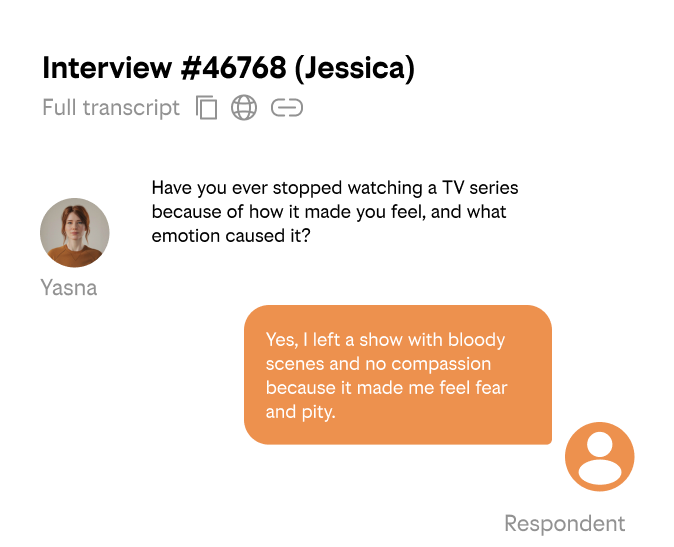
Why do people stop watching?
Overall, 31% of respondents from Turkey and Sweden have stopped a series due to feelings like boredom (6%), fear (4%), or sadness (6%). Swedes (40%) are more sensitive than Turks (23%), who push through. Surprisingly, offensive content or violence rarely kills the vibe.
Viewing preferences transcend gender. What matters is the emotional pull.
Plot is the leading factor for both genders (34% men, 29% women) and actors (25% each). Men are slightly more drawn to excitement (12%), reviews (10%), popularity (5%) and beer (15%). Women, on the other hand, give slightly more importance to the length of the series (7%), production quality (5%), language (2%) and for sips coffee/tea (19%/18%) .
Age differences: generational patterns in viewing habits.
40% of 18-24yo watch to pass time, 52% watch in solitude, chasing romance/horror/sci-fi highs. 25-34s balance escapism (17%) with social viewing (38%), prioritizing plots (35%).25% of 35-45yo relax relying most heavily on actors (36%), showing a stronger affinity for familiar or trusted performers and another important factor is the interest in stories (14%). Generations evolve from thrill-seeking to reflective.
According to Yasna’s insights, culture shapes everything: why we watch, how we feel, even what snacks we grab. TV is experienced differently around the world. With better storytelling, creators could turn casual viewers into loyal binge-watchers.
Tanya Berlina
Client Success Director at Yasna.ai

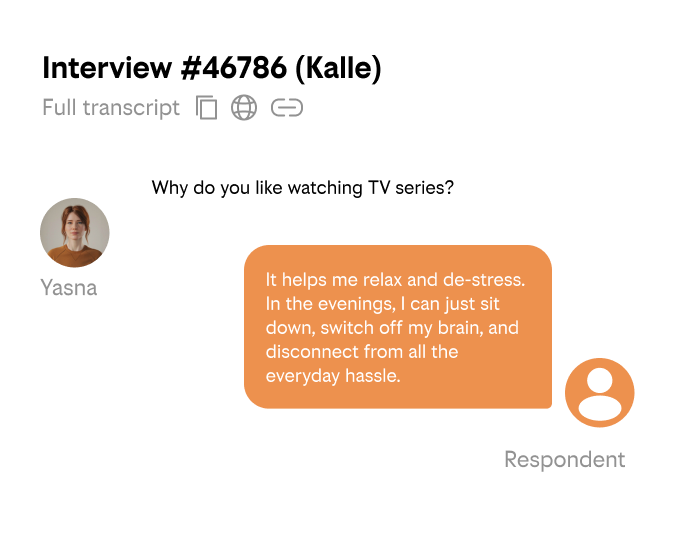
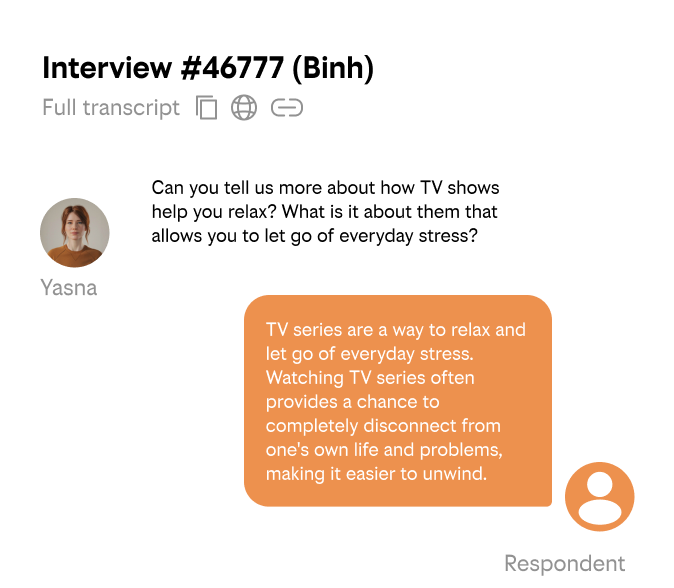
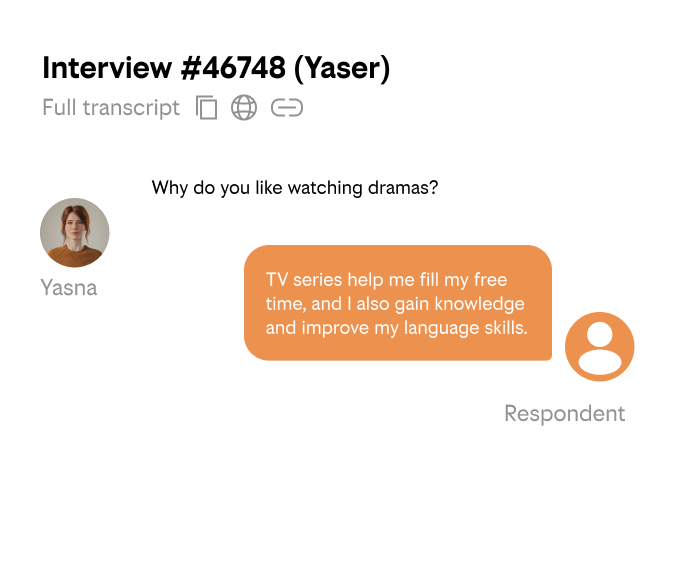
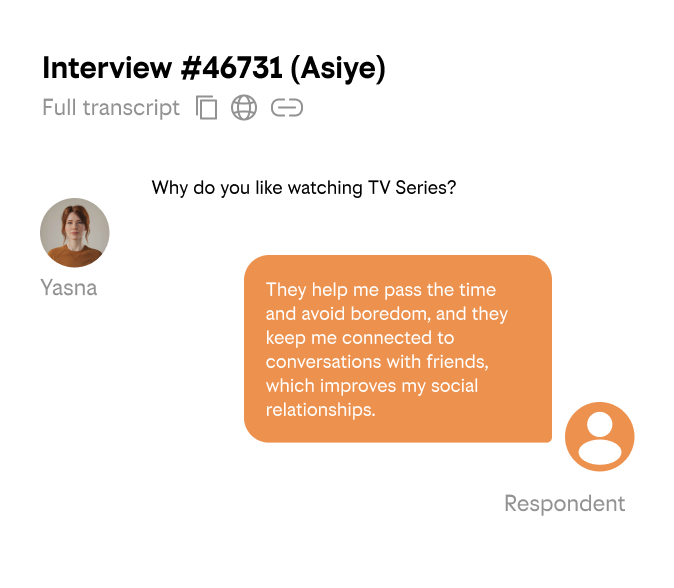
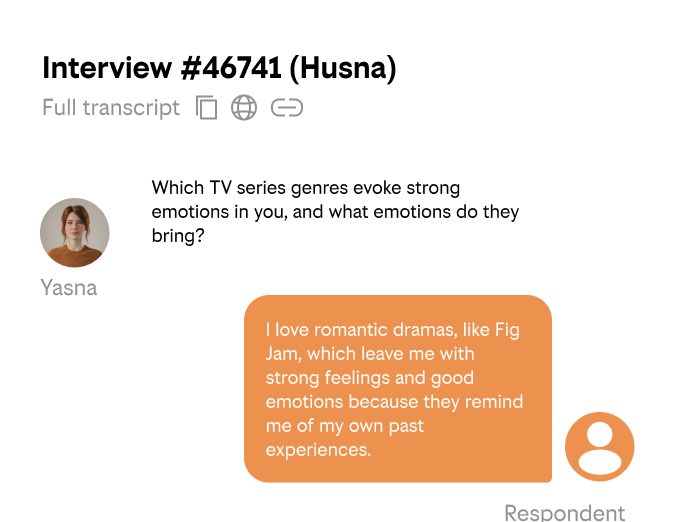
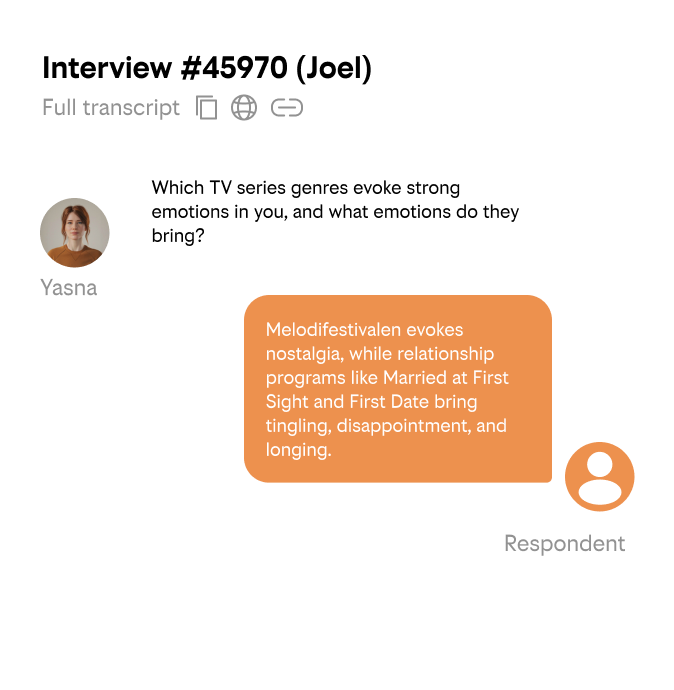
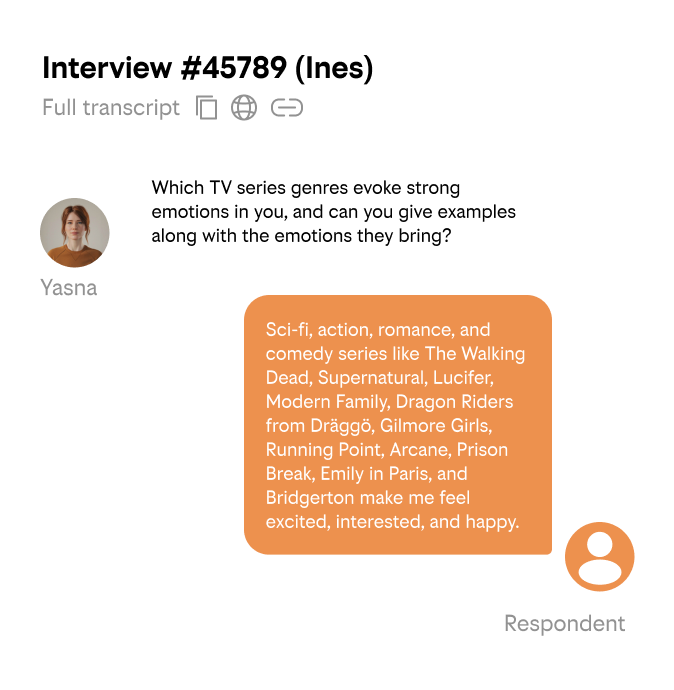
What’s inside the report? For every project, Yasna creates dialogue summaries:
These are an easy way to dive deeper into the stories while still enjoying a quick read.
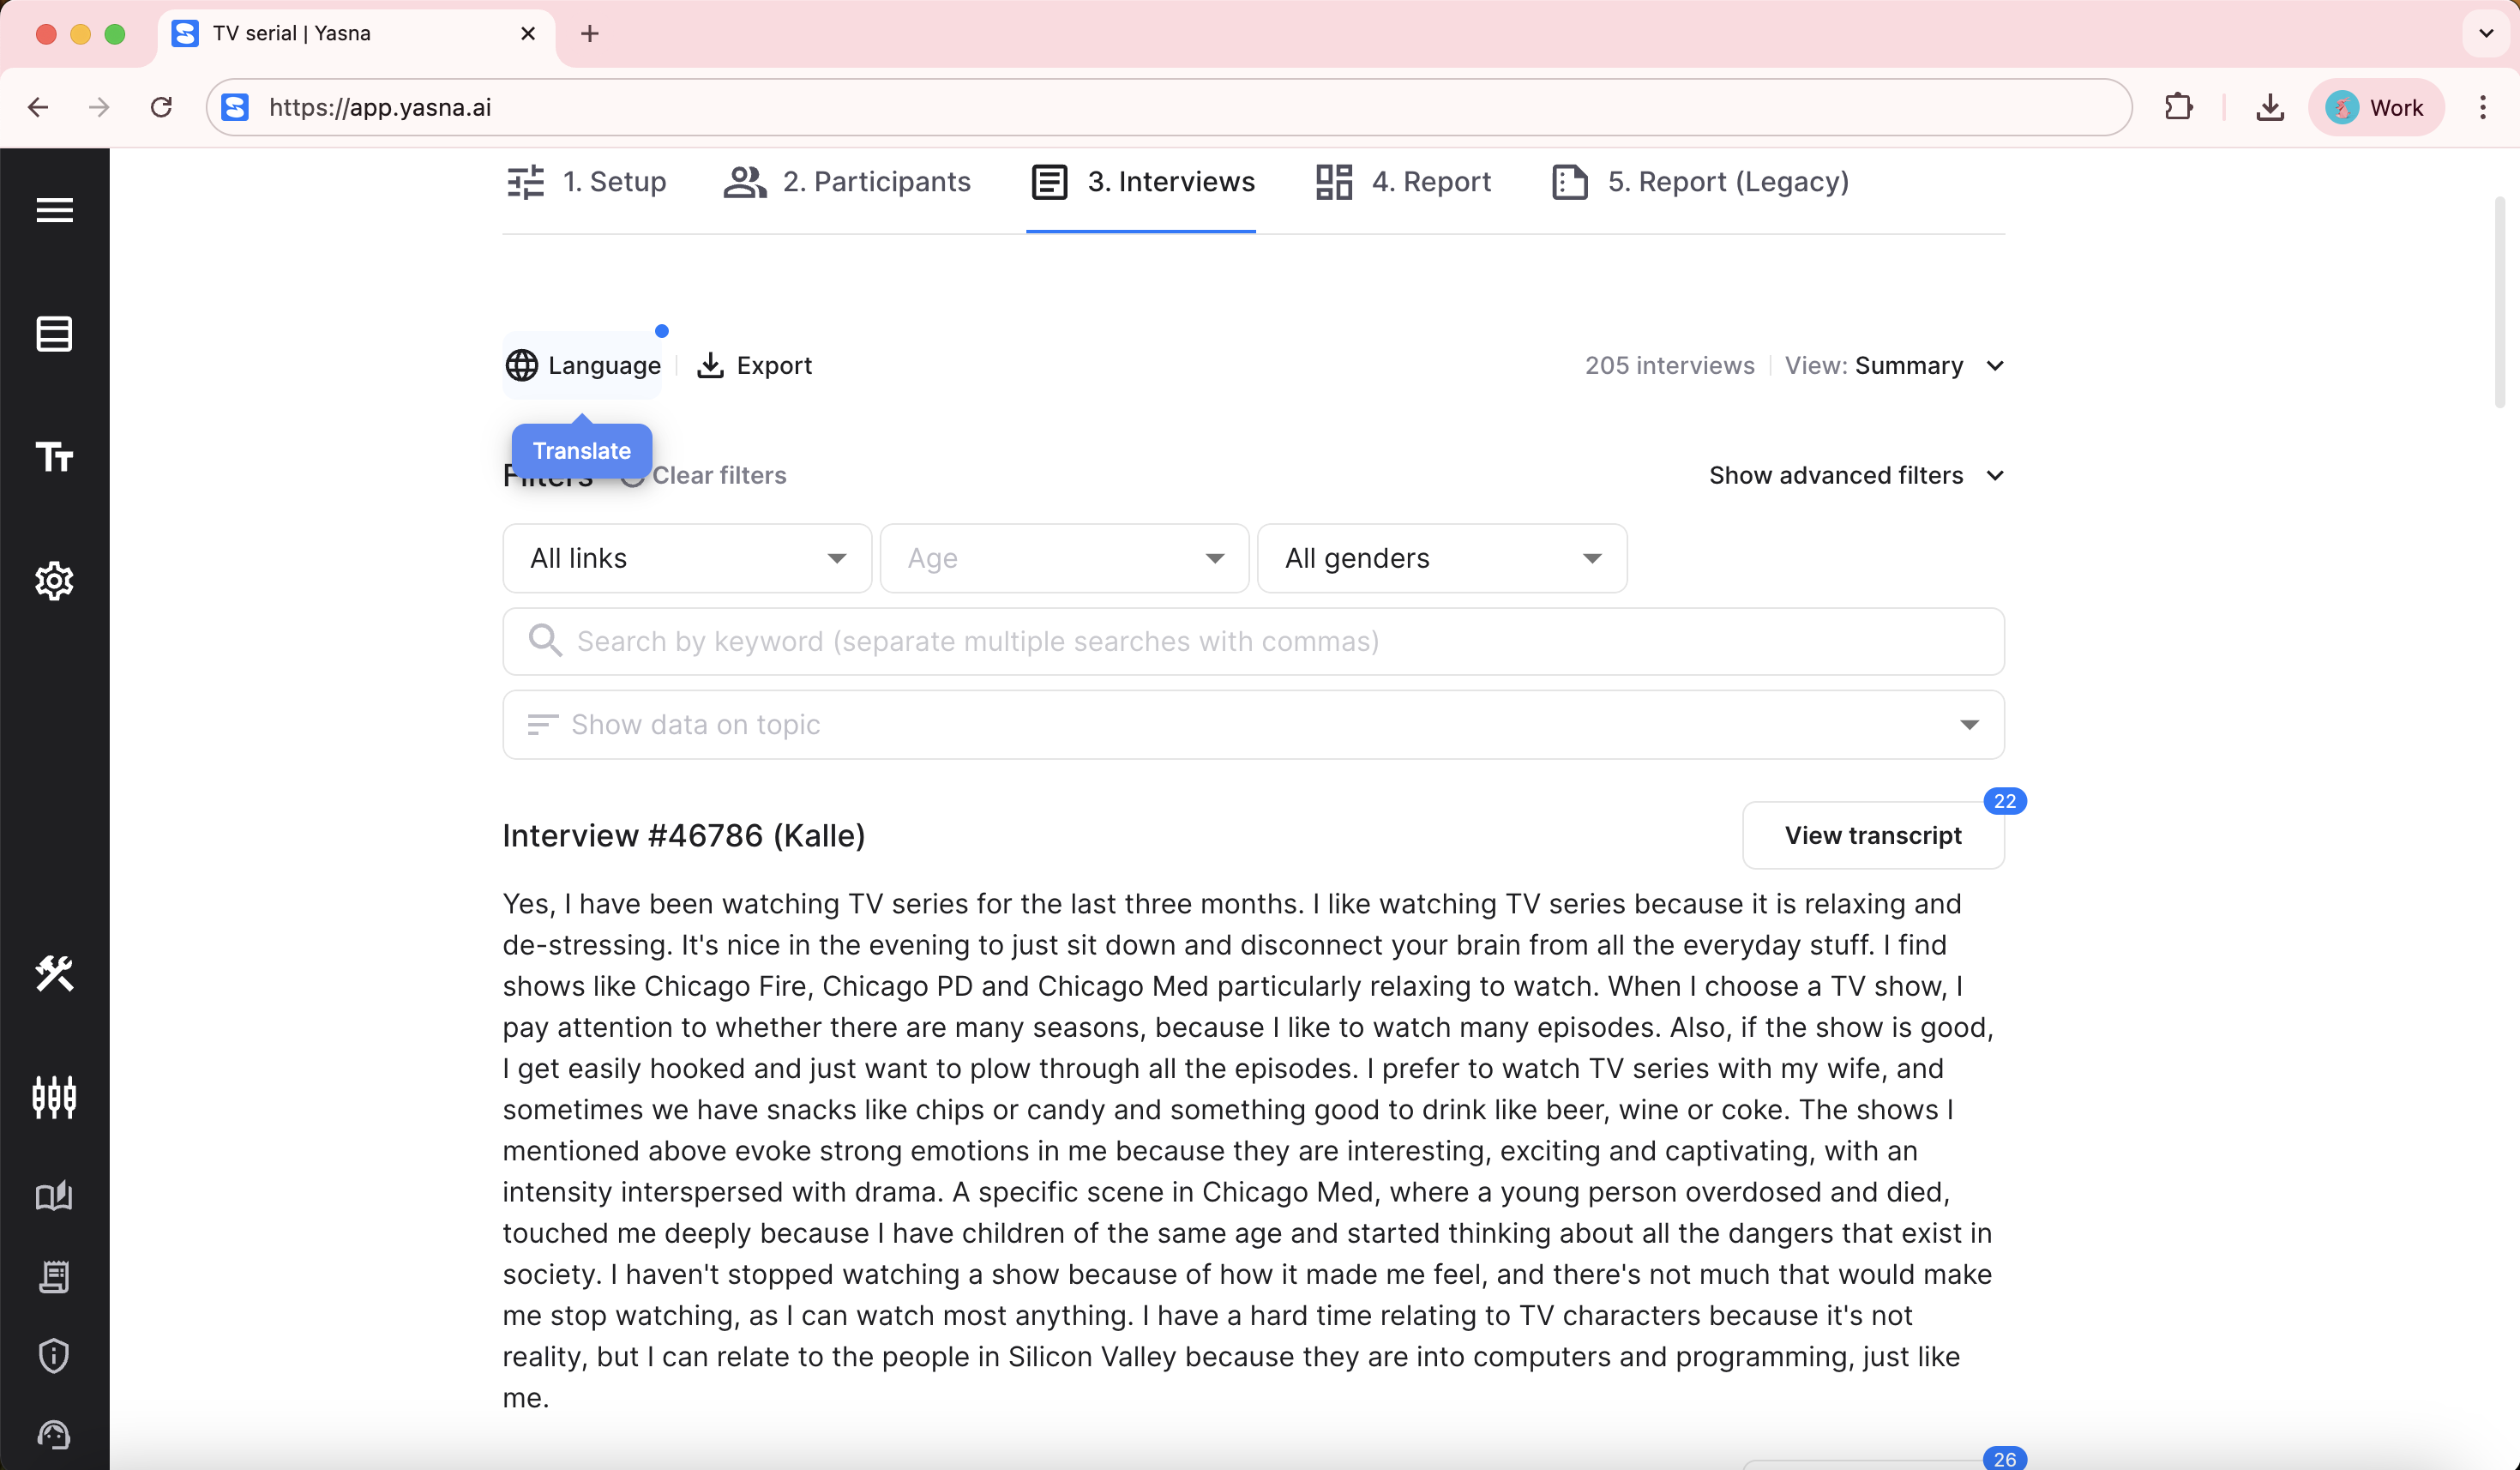
In the example above we’ve already translated two summaries that were originally in Swedish and Turkish into English (which took a second thanks to a built-in translator).
Love to see the numbers? Yasna has a scaling feature for that
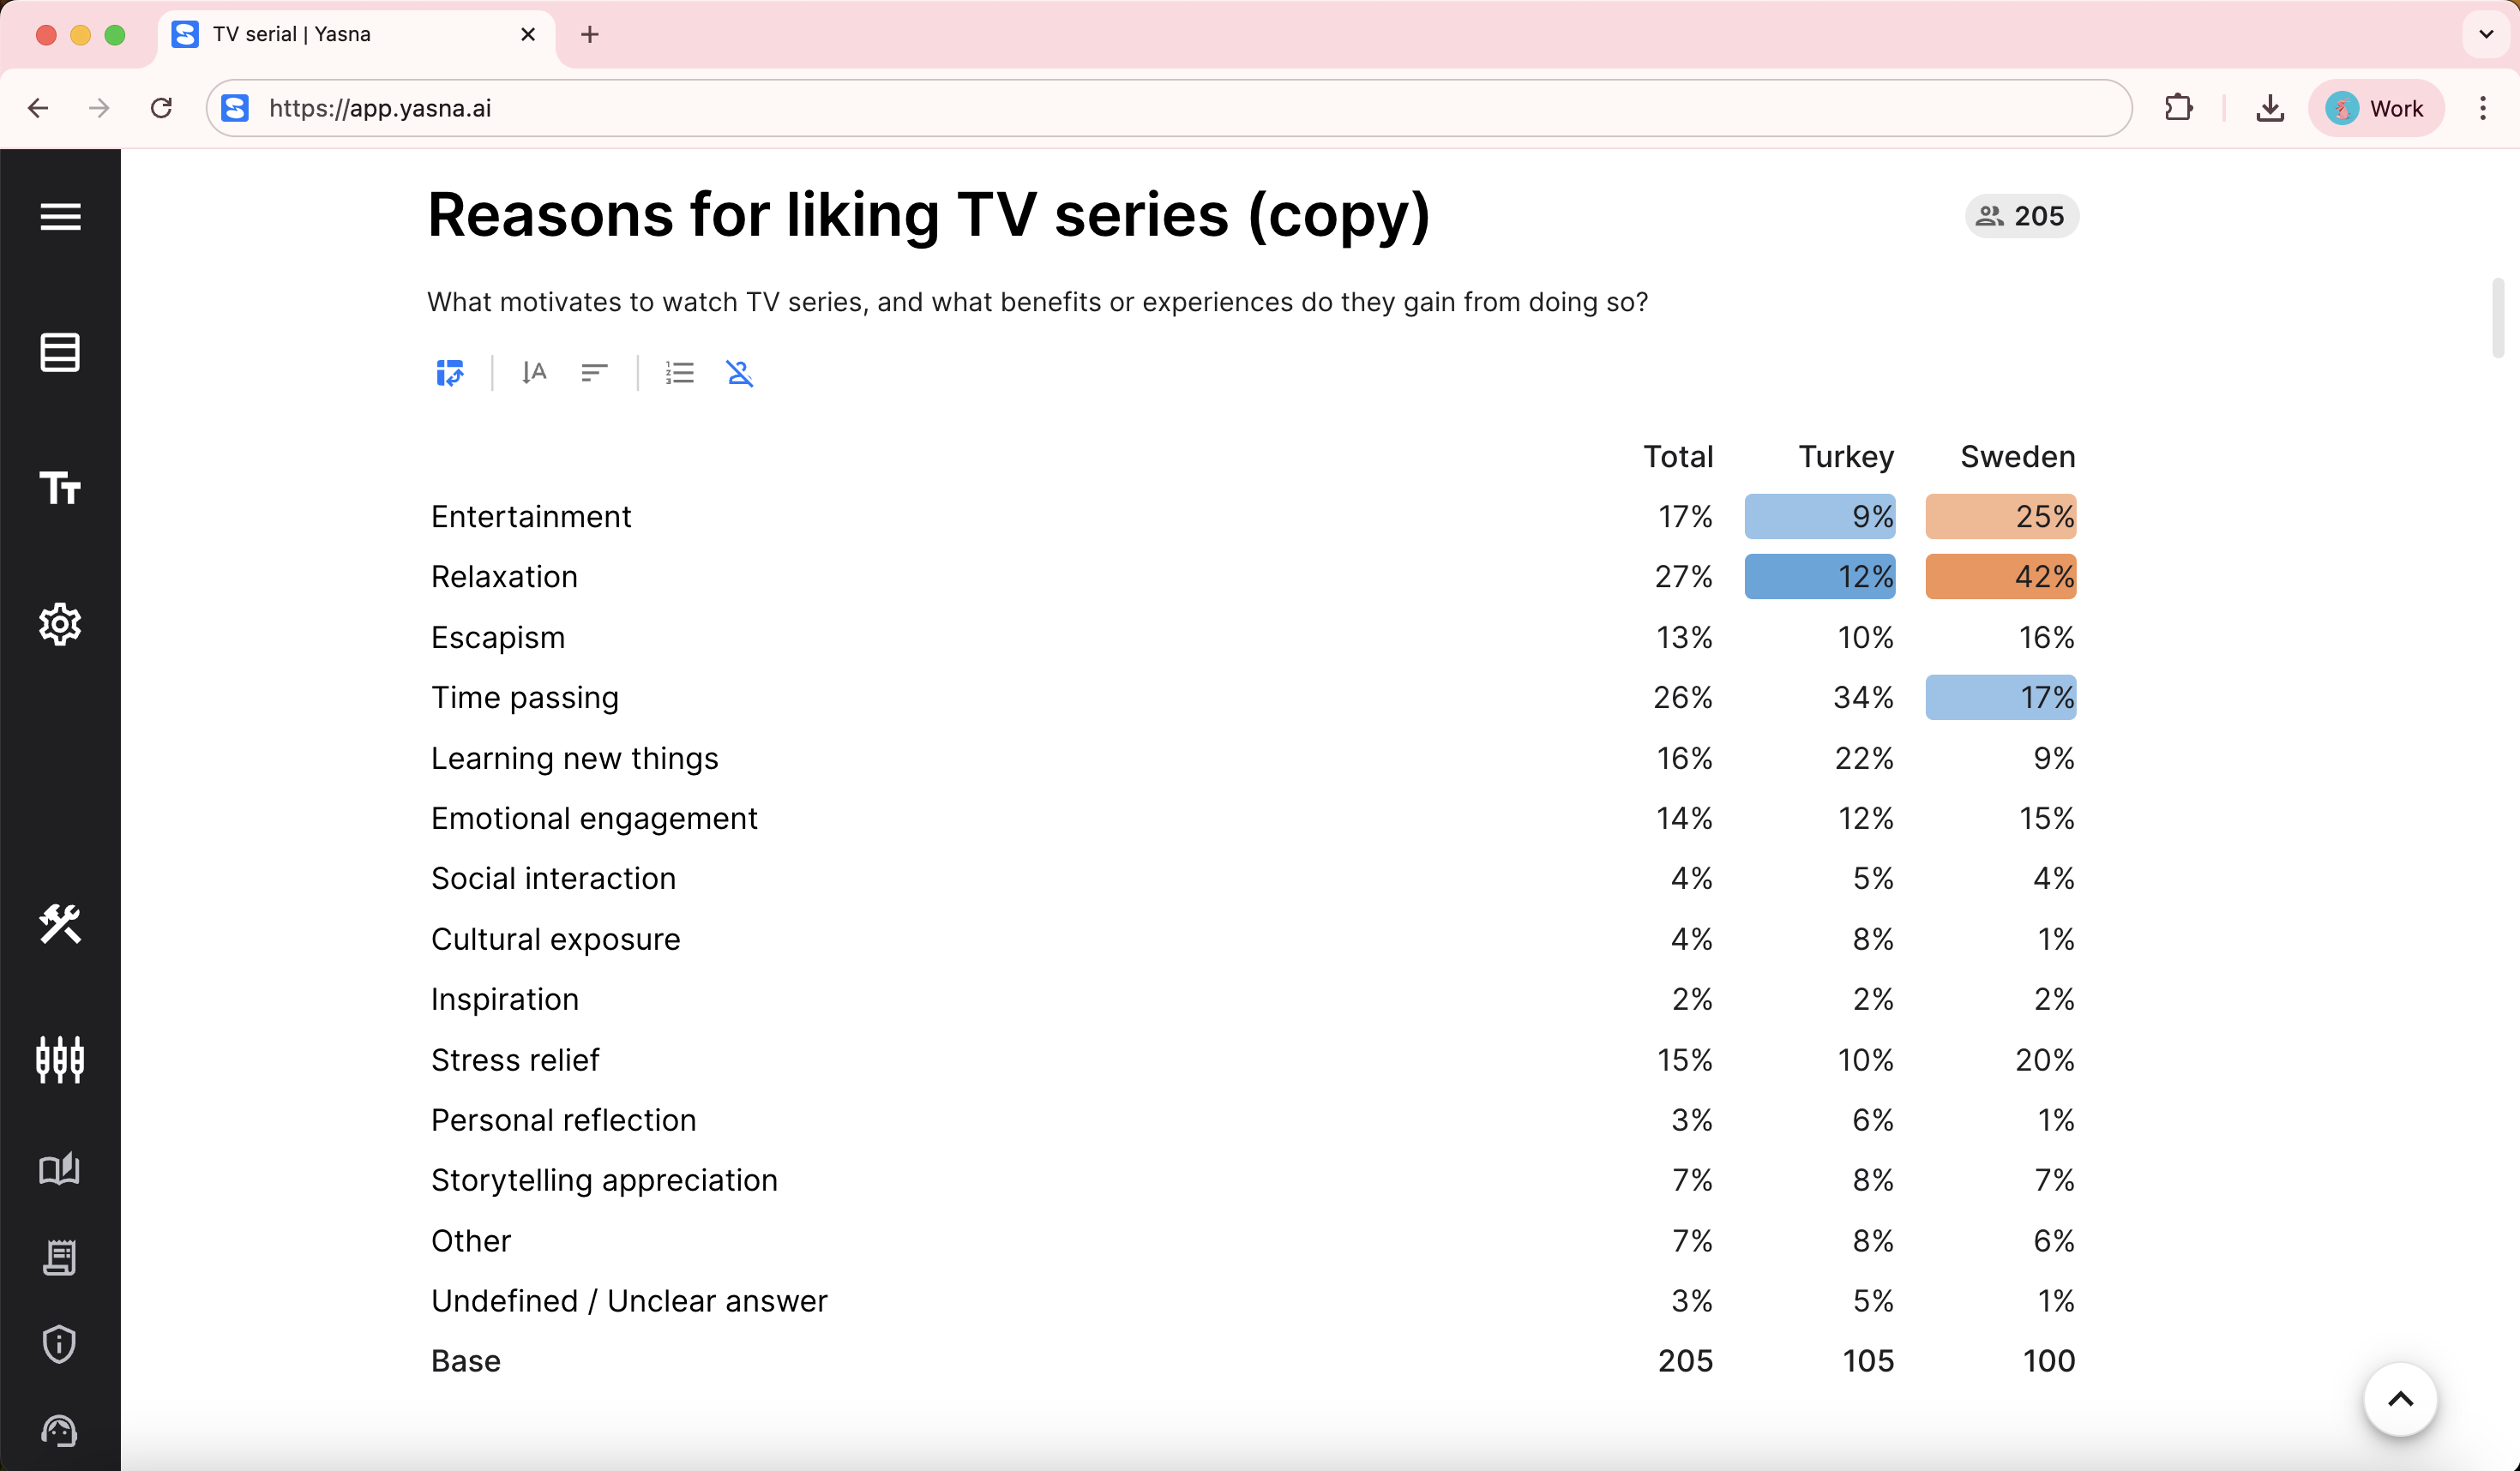
In this section you can explore the numerical data that validates qualitative findings from the previous section of the report.
In our case, there is a noticeable discrepancy between the stats from Sweden and Turkey. For instance: Swedes favor genre (19%) over actors (20%), while Turks reverse that (5% genre, 31% actors). Alcohol shows up in 26% of Swedish responses (beer 14%, wine 9%, cider 3%) but only 3% in Turkey. Emotional quits? 40% in Sweden vs. 23% in Turkey.
Yasna provides customizable conclusions based on the data from the interviews:
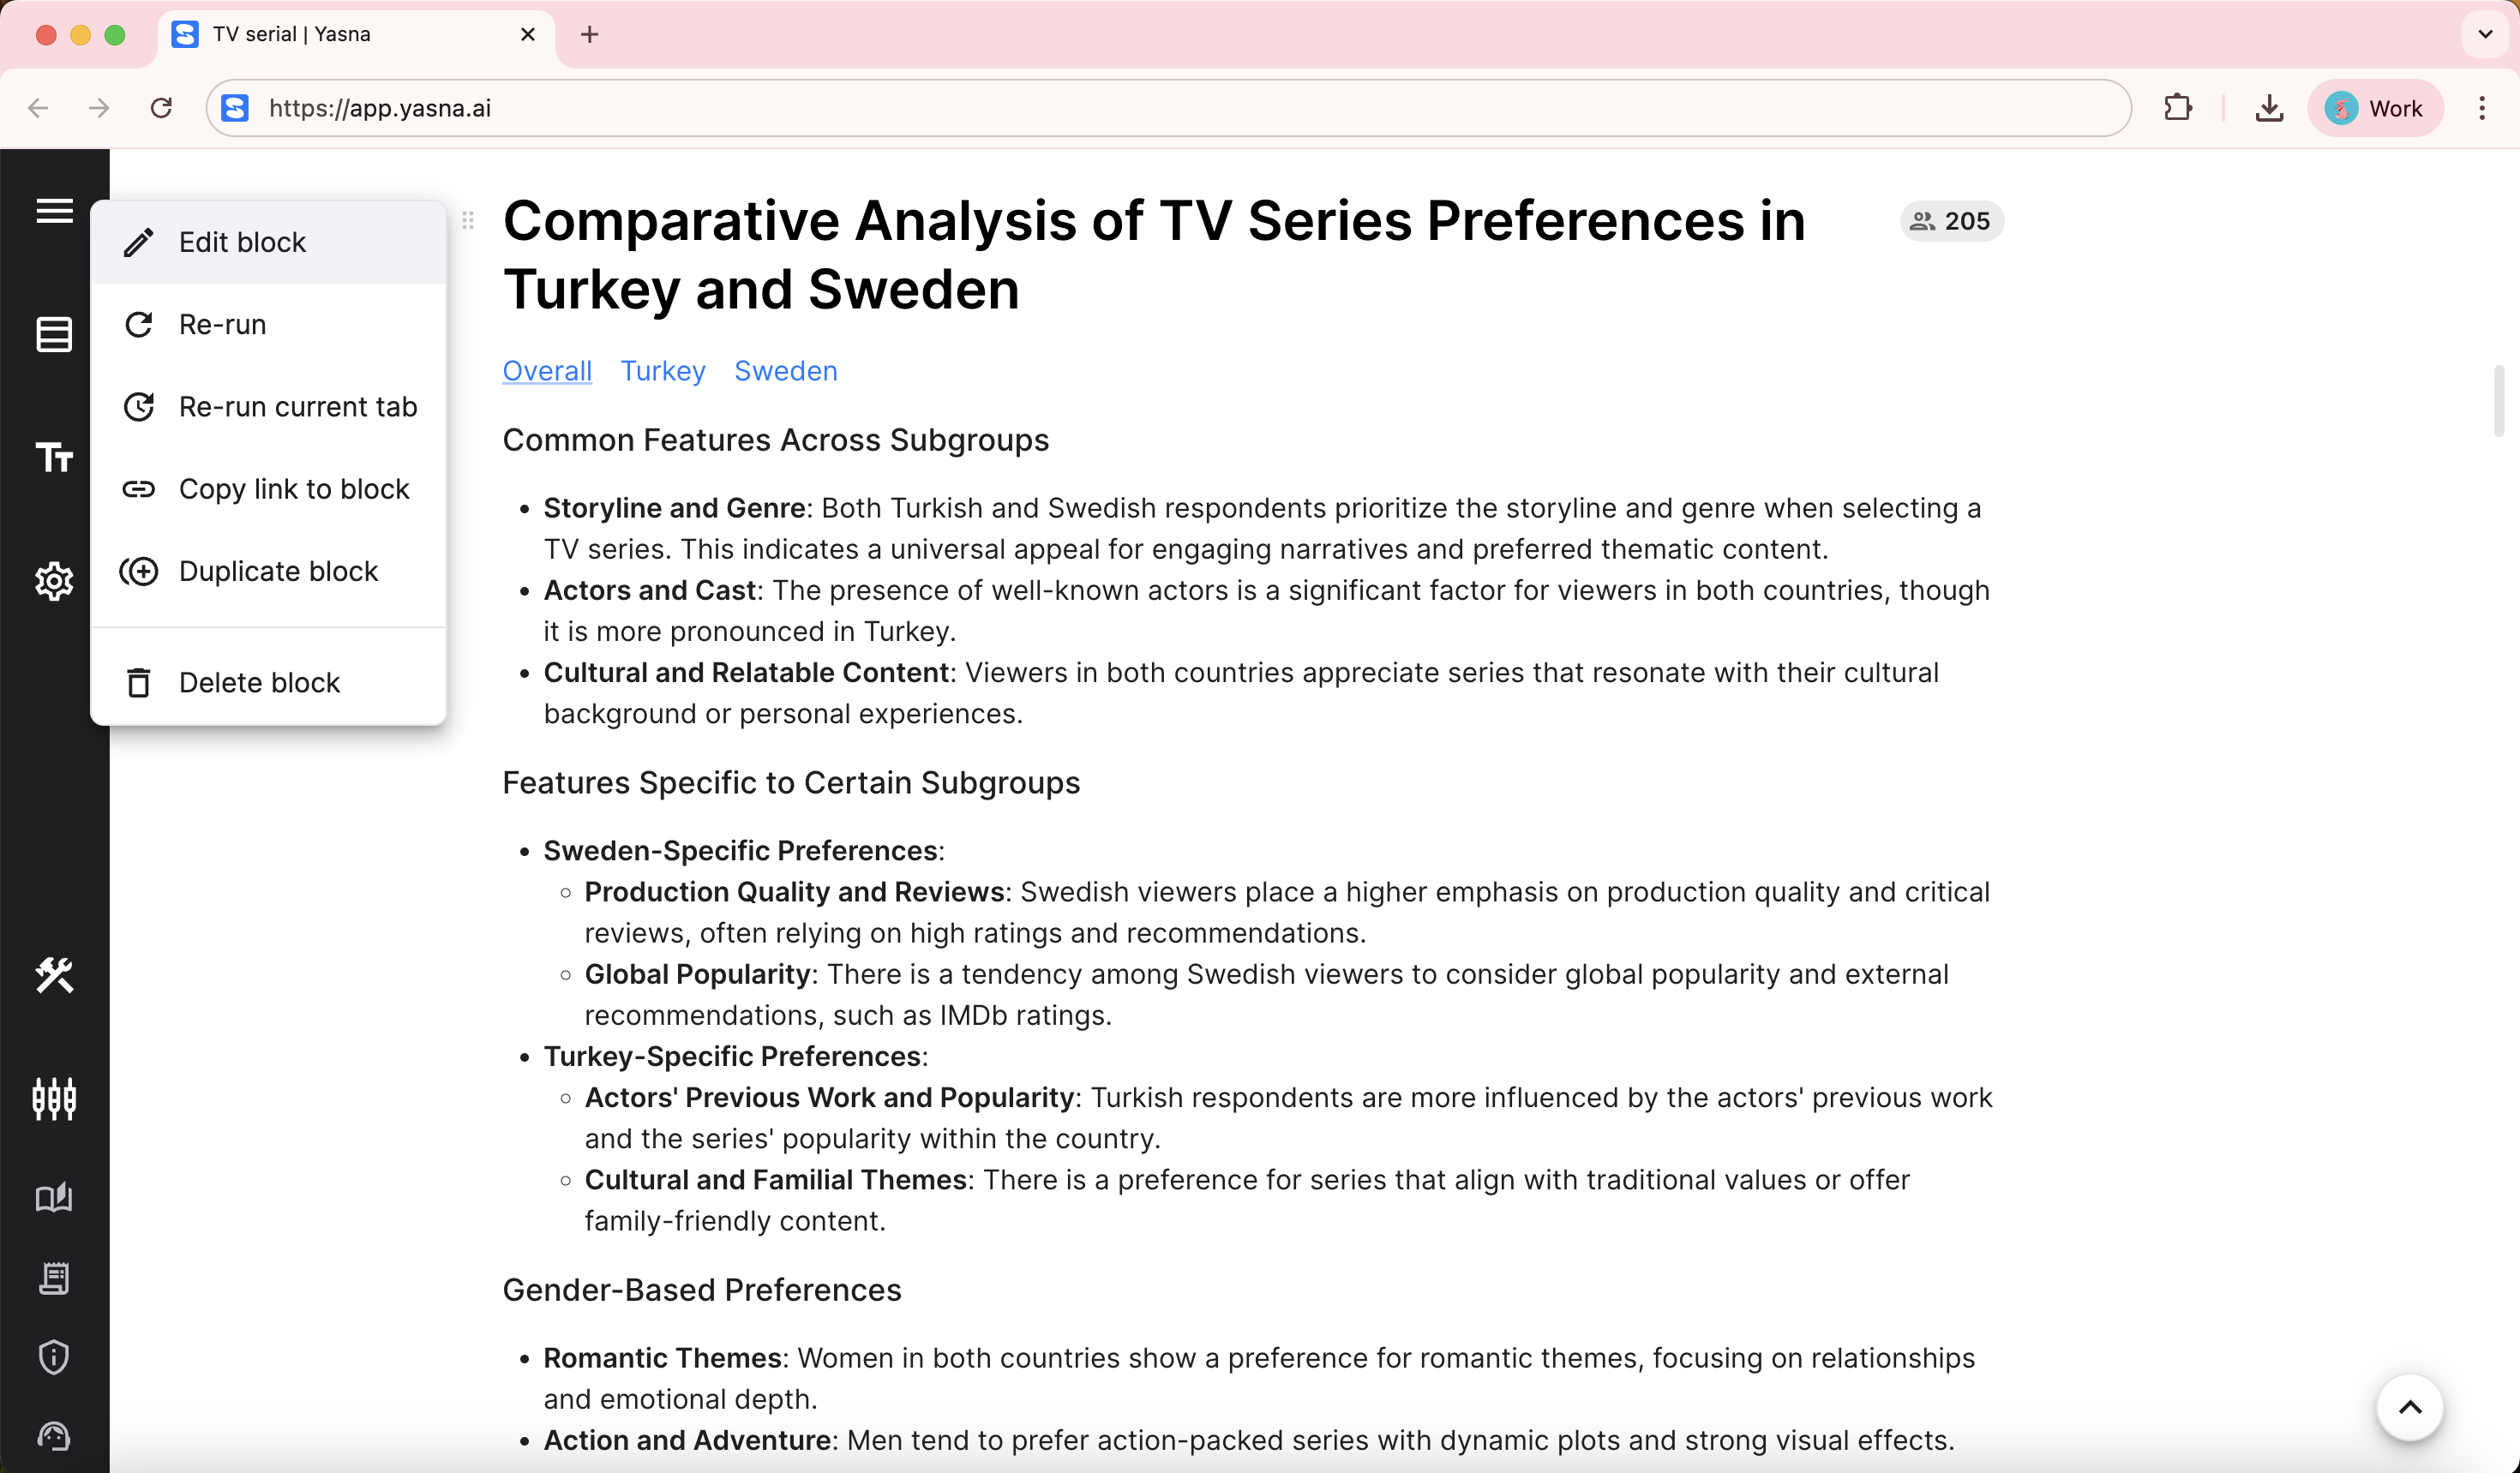
This part of the report provides a thorough understanding of the research results.
Each conclusion is supported by illustrative quotes. Each quote is linked to its source interview, so it’s easy to jump to the full dialogues.
For studies in different languages, there’s a handy one-click translation option. For example, today’s TV series study ran in two languages. Interviews in Swedish and Turkish can be instantly translated into English right inside the platform.
Curious to see how Yasna works? Book a live 1-on-1 demo or start your own project today. Uncover stories, trends, and cultural nuances at scale!
Continue reading
Top picks about AI-powered interviewing